Understanding Interaction to Next Paint (INP) + 4 tips to optimise and measure it
As part of our Web Performance Series, the most pressing metric to talk about is Interaction to Next Paint (INP) because from 12th March 2024, it becomes one of the three measures that define your website’s Google Core Web Vitals score and therefore your SEO ranking.
If you need a refresher on Google Core Web Vitals and how it impacts your entire eCommerce business, click here.
About our Guest: Karlijn Löwik

Introducing INP, the newest Core Web Vital
Everyone on the planet who has visited a website has encountered an Interaction to Next Paint (INP). Chances are that 99% of them, including you, experienced bad INP. You probably just didn't realise there was a name for this.
In fact, when people encounter bad INP, they believe the website or functionality is broken. It's not, but as a website owner it's something you should definitely try to fix!
After reading this article, you will understand what the Interaction to Next Paint is, why and how it occurs, how to measure it, and how to improve it.
And I'll try to write it in simple English, as performance is often a topic that mystifies people in its execution. Let’s bring it to the Hyvä audience, let's go!
Table of Content:
- What’s Interaction to Next Paint (INP)?
- What does Interaction to Next Paint mean?
- What defines a poor INP, and why should you care?
- Why FID is being replaced by INP
- Why does an INP happen?
- How to measure INP
- How do you visualise INP issues
- How Hyvä helps you improve INP out of the box
- Fixing INP issues on Hyvä stores
- Four Tips to Fix INP issues
- Conclusion
What’s Interaction to Next Paint?
Interaction to Next Paint is a web performance metric. It measures interactivity on a webpage. So it’s a frontend metric. Right now it's a hot topic too, as it will be replacing FID (First Input Delay) as one of Google's Core Web Vitals on March 12th 2024. It’s measured by Chromium browsers (Chrome, Edge, Opera) and tracks all interactions, but will then only submit the slowest interaction a user has within a page (ignoring outliers).
To put it simply, INP measures how long it takes the browser to display your desired action. You might even say that we should all refer to it as the call to action (CTA) metric*! And people who are forced to wait and could become frustrated when pressing a CTA is the last thing we want, right? So, thanks Google, for putting it into focus!
*Every web-performance expert in the world-- including Erwin Hofman, who’s co-authoring this article with me on the technical part-- is giving me the side-eye for describing it this way. Nuances incoming, people!
What does Interaction to Next Paint mean?
- The first part of the name pretty much speaks for itself: interaction. In the web performance community, this is defined as a user-action on a webpage.
Examples of a user action:
- Click or (on touch screens) tap, for example to
- collapse an FAQ
- slide out a navigation
- add a product to your cart
- Use of keyboard/key presses
- scrolling
- hovering
- Click or (on touch screens) tap, for example to
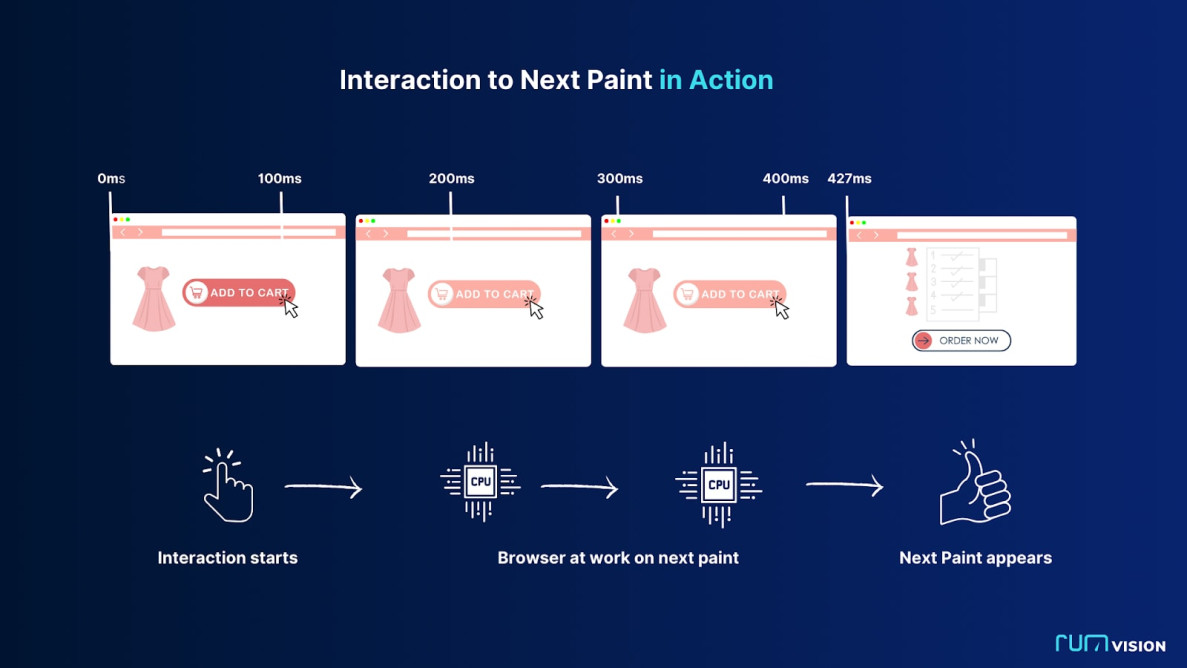
- Starting an interaction means that the browser must now perform an action, such as displaying something new that you requested that belongs to that interaction. This is the section titled "To Next Paint". There’s also a middle moment in this event, the processing time.
Let me show you, this is an INP event in action:
What defines a poor INP, and why should you care?
Google has actually set a benchmark for what constitutes a healthy INP: it must be less than 200ms. Above 500 ms is considered poor. It measures the worst experience a user had with an event/interaction on your page. It does account for outliers, the worst 2% are filtered out. If you want to know exactly how that works, Google’s own documentation has you covered https://web.dev/articles/inp#what_is_inp
When an INP is poor, it can be extremely annoying to your users. It will even cause you to lose conversions.

Some examples of poor INP in action
Imagine clicking on a button, such as "add to cart," and it is not working!
- You try again, and it suddenly works. But with a noticeable delay. That is a poor INP in action.
- Another example: you attempt to fill out a form but letters appear on screen in a laggy way. Poor INP as well.
- You are navigating around via the menu of a website, but it feels like a new subcategory is sliding in too late. Poor INP.
Why FID is being replaced by INP
According to data from Chrome, the majority of a user's time on a page is spent after it loads, specifically 90%. We found, in an article we wrote with Google, that most mobile delays happen after the user has already spent 10 seconds on the page.
Because of this, you should think about those experiences and make sure they aren't frustrating. You should aim for a website that is lightning fast in responding to user actions in order to prevent bounce, boost revenue, and keep customers coming back.
While First Input Delay (FID) did try to measure responsiveness, it could only shed light on the user's first interaction delay and therefore painted an incomplete picture, as it missed all the rest. This is also why just about everyone passed FID. When INP takes place, there will be a significant drop in the number of people who pass the Core Web Vitals.
Amount of sites that currently pass the FID, so it doesn’t surprise you that there is finally a better metric:
- Desktop: 99.9%
- Mobile: 94.1%
Keep in mind that Google isn't intentionally trying to annoy you with this. It was happening regardless of whether or not Core Web Vitals measured INP. Interaction with Next Paint is designed to help you with visualisation of where and how bad.
Why does an INP happen?
For this, we need to get a bit technical and go to the basics of how a browser works.
A browser is always hard at work at showing you the latest version of the exact point of the webpage where you are. It tries to refresh the page very often, 60 times per second to give users the illusion that everything is running smoothly. Any faster wouldn’t be noticeable for human beings.
But browsers could be prevented from achieving or actually rendering 60 frames per second for several reasons.
JavaScript and rendering
JavaScript is the natural enemy of INP. That's because a browser will wait for the JavaScript files to be compiled, parsed and executed before moving on to rendering (painting) the rest of the page.
And it doesn’t matter if you’ve got multiple code-splitted JavaScript files or one big bundle. Both have the potential to cause a delay. Or maybe even multiple within one page visit. It all depends on the amount of work a task is triggering.
It might not always be a UX risk, but it will when such a task either takes place during interaction, or a long task is triggered as the result of user interaction. The challenge here is that browsers try to be performant by batching JavaScript tasks together instead of updating the screen on every single JavaScript task.
That’s a good thing, but as paints are delayed until batched JavaScript tasks are done, it becomes easy to understand how and why a new paint -and basically the most noticeable and thus important part for your typical visitor- can be delayed.
And thus: browsers are just like men, they can't multitask. And this is the basic issue in an INP.
Let me show you:

Let’s understand the 3 stages of what happens in an INP
As you can see in the above graphic, Interaction to Next Paint is not just a single moment in time. It actually measures all the events that happen to get from the interaction to the new “paint”. The INP metric then calculates the sum of them. Delays might happen for different reasons, so I’ve added a couple of examples as well.
Input Delay
Input delay is the amount of time that passes between when a user begins to interact with a page and when the actions or event callbacks that go along with it start to run.
An example: You clicked on a hamburger menu, but exactly during interaction, some other script was still running. This could be Facebook, a chat widget or hydration of your SPA/PWA. As a result, the browser could not get to the part that is responsible for sliding out the menu right away.
Processing time
When the system gets the user's input, it has to process it to figure out what to do next. Processing time is the amount of time it takes for the system to look at the input data, figure out what it means, and perform any calculations or operations that need to be done.
An example: You clicked on a hamburger, but either the theme or developer wrote a very complex JavaScript mechanism to actually trigger the menu.This interaction is the cause of the additional work required
Presentation Delay
Next to JavaScript, layout and rendering work often needs to be done as well after user interaction. This involves changing the pixels on the screen to give users an expected result. When processing time causes many elements to be restyled or when many new HTML elements are inserted, the browser is forced to render more elements.
An example: After your JavaScript told the browser to slide out the menu, one is expecting a visual change. But many menu items might have been given a new color as well, causing a longer delay before being able to present a new updated frame.
Let’s visualise the duration of these 3 steps when clicking on “allow cookies”, cumulatively building up to an INP of 539 milliseconds.

Depending on how the cookie notice chooses to act on the interaction, the processing time and thus overall INP could be lower when denying cookies, instead of accepting them.
Why you should buy your visitors the latest, most expensive phone to fix INP
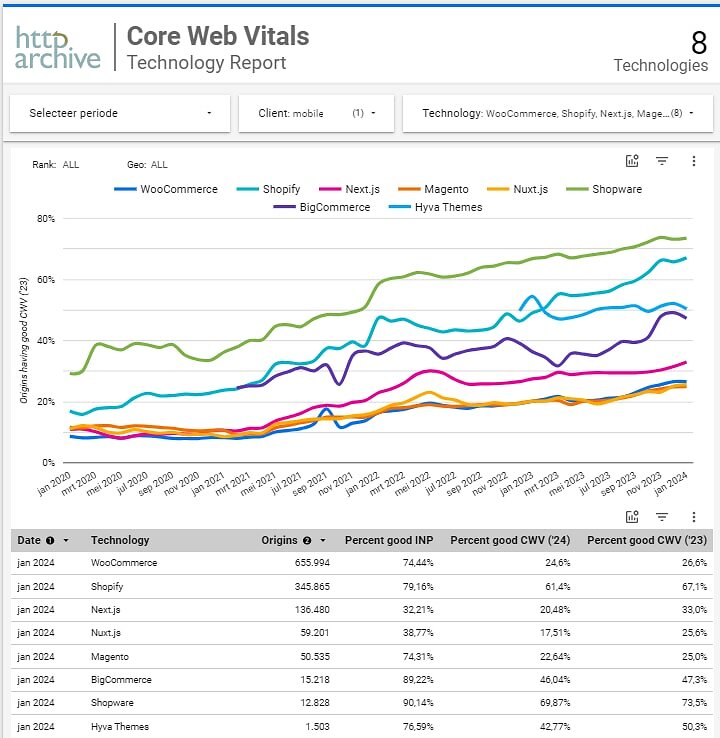
The size of your device's memory/CPU has a significant impact on how quickly your browser can perform tasks as described above. This means that people on mobile almost always have a worse INP than those on desktop. When we zoom in on INP in the HTTP archive technology report, we can see that on desktop 99.35% of Hyvä sites have good INP. On mobile, however, only 76.59% have good INP.
But also, not all mobile phones are the same! A quick win to fix your INP issues we suggest as a joke:

A bit expensive, but there’s a truth to it. If you really want to deep dive into this, I recommend reading The Performance Inequality Gap, 2024, which will explain to you how having a good phone greatly helps performance.
Factors at play
Not only do a phone's capabilities affect its performance, but other factors can also play a significant role. Temperature, for instance, can influence how well your device operates. Attaching an ice pack to your mobile device could make it run 15% faster.
Using the same device in Greenland and South Africa likely yields different results and thus experiences.
This illustrates the various reasons your device may be running slowly, whether consistently or occasionally.
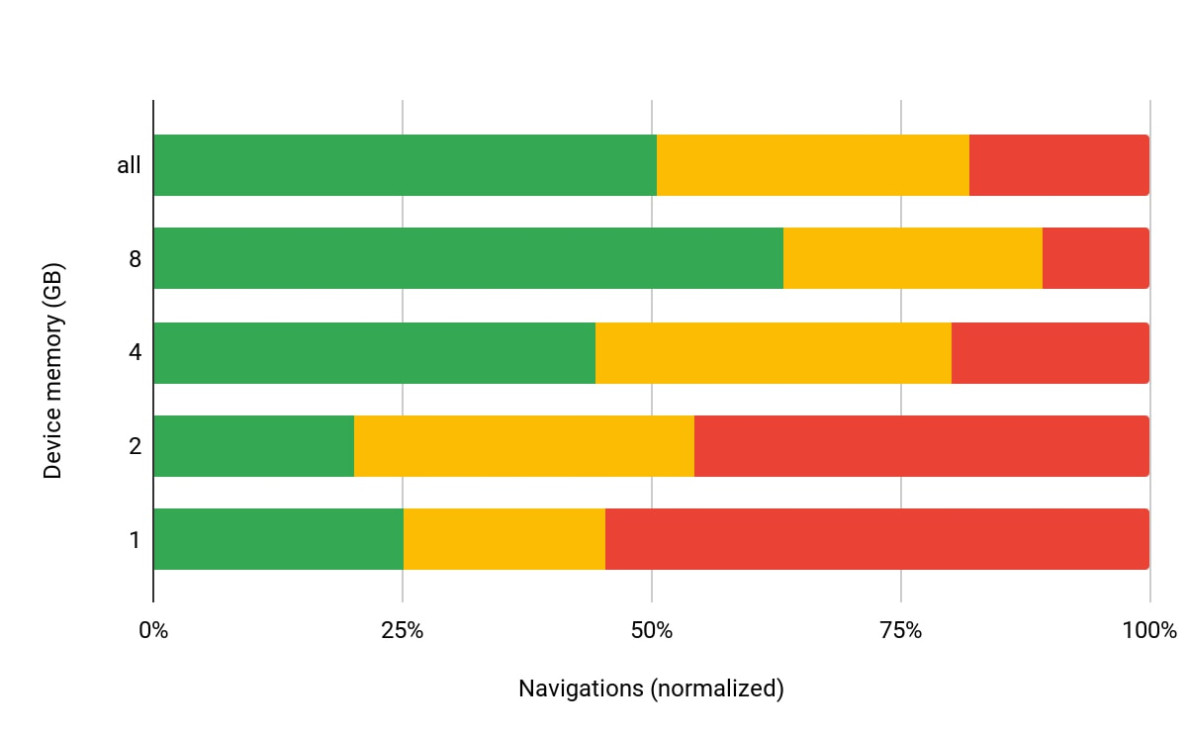
Let’s look at some real world INP numbers calculated from our own RUMvision dataset: the graph below shows a normalised representation of users' real-world experiences with INP. By the width of the green bars, we can see that users with a minimum of 8GB device memory ended up having a healthy INP more often than those with 2GB or less.
Simply put: if your visitors have a lot of cheaper/older phones, your INP will likely be worse, forcing site owners to work harder to offer their audience a healthy experience. Even within Europe, launching an existing shop with a Scandinavian audience to Spain while keeping the stack exactly the same might force you to optimise a bit more.
But regardless of the device being used and any other variable, improving visitors' INP will benefit all users. And some will end up benefiting more from your performance optimization efforts than others!
And the good news is that we can measure and visualise exactly that. For every website and every audience!
Does this mean that webshops that sell expensive products have no problem passing INP?
When deciding to sell products to high end consumers, you might be off the hook as your audience then is more likely to have the budget for and thus browsing with high end devices as well.
But without monitoring, you will be blind to changes in used devices, change of audience, et cetera. And when talking about Core Web Vitals we're not talking about hypotheticals, as we’re dealing with your real audiences and revenue - with a couple of factors to keep in mind:
- People who buy expensive things don't always have expensive phones. It’s hard to admit, but I personally drop or break my phone at least once a year, so I won't buy one that costs more than EUR 300. But using a mid-end device doesn’t stop me from shopping on your site with high-end products.
- Core Web Vitals are based on information gathered from Chrome browsers. If iPhone users browse with Safari, that data won't become part of the CrUX dataset, which means it won't help you pass Core Web Vitals.
- What do users expect when browsing your high-end webshop? As we established, a good INP score is 200ms for the slowest interaction on a page, in an average of users' experiences over your whole site on the 75th percentile. Without getting too much into this -as we can write a whole blogpost just on this- there are two key considerations here. Namely: the 75th percentile means that 25% of your users had a worse experience, but they might still want to buy from your shop. Optimising to improve experiences to the 80th or maybe even the 90th percentile might make you a lot more money. Another factor is that people browsing on high-end phones might actually experience 200ms as really slow, as they are used to fast response times.
When you think about these things, it's easy to see why you can't just assume that having a high-end shop won't get you off the INP hook.
A real example is the Citizen Watch Case Study, a high-end brand who successfully improved its online sales conversion rate by focusing on its Core Web Vitals, especially on Mobile devices.
This is also where having a real user monitoring solution showcasing what exactly people are experiencing becomes very practical. You can’t improve what you don’t measure.
How to measure INP
In the web performance world, Interaction to Next Paint is based on what we call "field data".
Lab data
In lab data -such as Lighthouse- the closest but lacking metric is Total Blocking Time (TBT). Lacking because it will typically measure a new uncached page hit where cookies aren’t accepted and most third parties will not be loaded. It also will not scroll or click, so any lazy loaded JavaScript might not be executed during such a synthetic lab test.
And even if you would try to simulate interactions, every user has a different perception of when they can start to interact and will interact during different moments in time. A page will behave differently every time, users will interact at different times. Making the correlation between TBT and real UX relatively weak.
Nevertheless, Google offers strategies for reproducing slow interactions in the lab on web.dev.
Field data
That means that you need data from real visitors and real interactions from the field. This is what Google is doing with Core Web Vitals, sending such information to the Chrome User Experience report (CrUX).
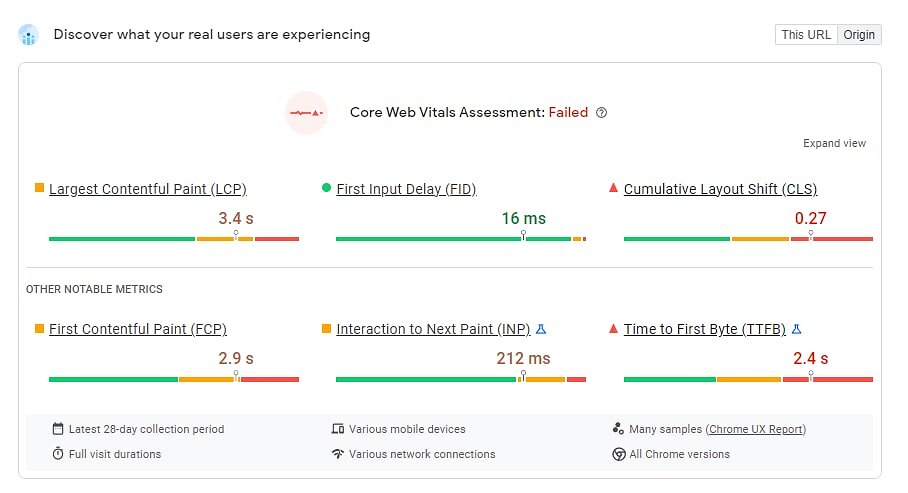
When your site has a sufficient number of visitors, you’ll get to see a field data report above the fold when using PageSpeed Insights.
The score you see at the top will be considered "good" if at least 75% of all pageview experiences within the tested page are less than 200ms - keeping in mind that INP only represents one of the slowest out of many interactions on a page.
Google suggest starting with RUM to avoid guesswork and wasted effort
“Ideally, your journey in optimising INP will start with field data. At its best, field data from Real User Monitoring (RUM) will give you not only a page's INP value, but also contextual data that highlights what specific interaction was responsible for the INP value itself, whether the interaction occurred during or after page load, the type of interaction (click, keypress, or tap), and other valuable information.
While Google’s publicly available CrUX data is useful to tell you that there is a problem at a high level, it often doesn't provide enough detail to help fully understand what the problem is. A RUM solution can help you drill down into more detail as to the pages, users or user interactions which are experiencing slow interactions. Being able to attribute INP to individual interactions avoids guesswork and wasted effort.“
How do you visualise INP issues
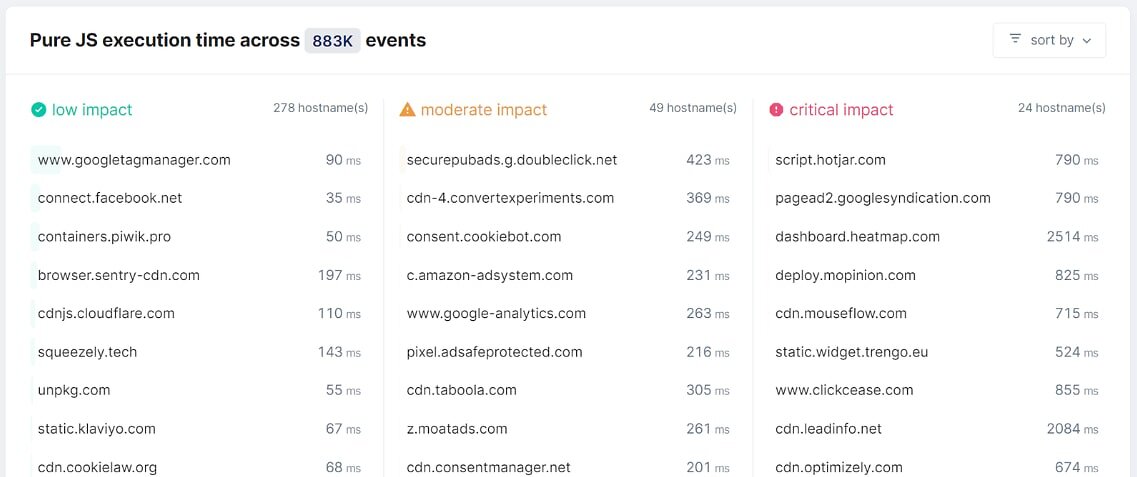
One must appreciate Google making one's business case, and we at RUMvision certainly do! Because we as a real user monitoring solution do all of these things, and many more. All of the situations described in this article are issues that we can measure and visualise. This includes INP per template, INP by device memory, INP per element, INP per country and INP breakdown.
Collect real-time measurements of your own visitors by simply installing our small JavaScript snippet and get started on debugging INP. The insights RUMvision is offering don’t stop here though:
Meet LoAF
Google wants to help you improve INP. The newest API in their toolbox to help debug INP is called LoAF, which stands for Long Animation Frame API. This is an absolute game changer in terms of observing what’s happening within an INP, or more specifically, a long task that’s blocking the main thread and thus the users’ interaction.
As might have become clear by now, JavaScript is often the biggest offender. But whose JavaScript is causing the issues, your own or from third-parties? And which exact third party? How often do they occur? And where? You can use the API yourself, or benefit from our efforts collecting this in bulk on behalf of your site.
RUMvision is visualising and grouping collected data, allowing both technical and less technical stakeholders to learn what’s going on and start discussions around the topics that will move the INP needle the fastest.
Did you know we were the first RUM to adopt and embed this API? Our efforts and outcomes helped Google to confirm that this API comes with valuable insights and was on the right track.
As a matter of fact, the LoAF API will become stable in Chrome 123.
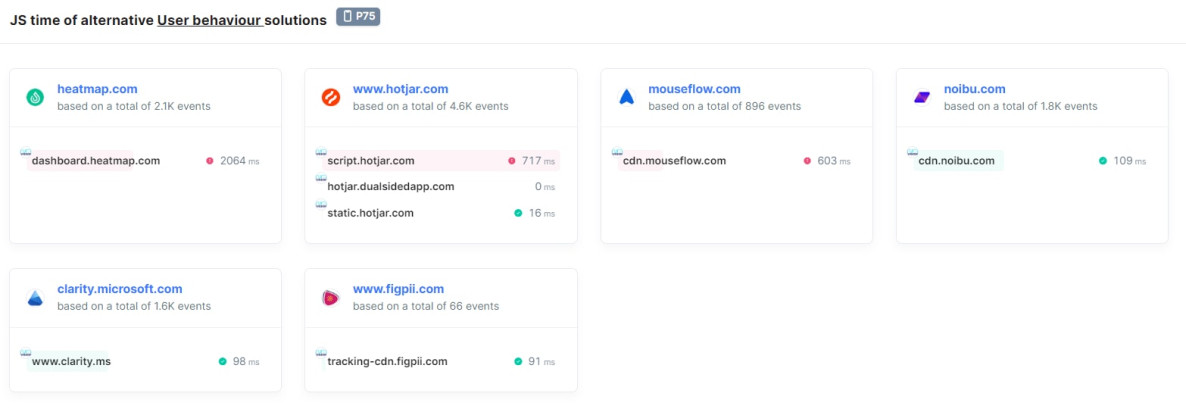
By collecting this information in bulk, RUMvision is able to show you benchmarks to compare a third party your shop is using with other -maybe more performant- third party solutions within the same niche.
When you want to measure INP to debug I honestly think RUMvision is the best solution out here right now to do so. Even more for Hyvä, who work very closely with us as an official technical partner.
Other ways to measure INP
Aside from real user monitoring, my favourite way to debug Interaction to Next Paint issues is the performance panel within DevTools. This way, you can start a recording and go through a user journey. You will then see flame charts and which tasks need to be executed when you and your users click. Disclaimer: This is not easy!
How Hyvä helps you improve INP out of the box
This part is provided by Hyvä themselves, as they obviously know a lot more than I do regarding their efforts to improve performance.
The overall benefit that Hyvä provides concerning performance and Core Web Vitals is a huge reduction in the amount of code shipped to the browser, meaning there is less to compute and therefore faster load times, especially when compared to Luma (default Magento). Hyvä Themes was built from the ground up with performance in mind, so hasn’t had to ‘retrofit’ performance enhancements (which usually add more bloat):
- Reduction in page requests (5 vs 230)
- After the HTML document, we have 1 CSS file, 1 JS file, a logo and a favicon!
- 98% reduction over Luma
- Reduction in page weight (400KB vs 3 MB uncompressed)
- 86% reduction over Luma
- Smaller CSS footprint due to the use of Tailwind CSS (100KB vs 750KB )
- 85% reduction over Luma
- Reduction in JavaScript parsing and evaluation time due to fewer libraries used (40KB vs over 2MB uncompressed)
- 98% reduction over Luma
Hyvä is also committed to keep improving, helping you to pass INP more easily in the future, with numerous improvements being planned and reviewed.
Fixing INP issues on Hyvä stores
When INP replaces FID there will be a drop in the relative amount of Hyvä websites passing Core Web Vitals. This is reflected in the publicly available CrUX dataset, where we see that of the big eCommerce solutions everyone will take a Core Web Vitals “hit”.
It shows that as of the Core Web Vitals change on March 12th, the number of sites running Hyvä that pass Core Web Vitals will decrease by about 7%.
So, how do you ensure you pass INP with your Hyvä store? In January 2024, 76% of Magento sites using the Hyvä Themes passed INP. Let's work together to get those numbers up! The following sections explain how Hyvä can help, as well as practical tips for sites that do not pass Interaction to Next Paint.
4 Tips to Fix INP issues
Every site and its users’ conditions are different, but I’ve asked pagespeed consultant Erwin Hofman for some tips on issues he often encounters, and how to fix them. He was happy to share them:
Tip 1. Tame your third parties
One of the main reasons that INP issues happen on websites, including Hyvä, is when third-party scripts start interfering with the main task of the browser. We already saw this reflected in the LoAF part of this article as well. When you want to improve INP, I suggest you start by getting a grip on your third parties. This includes a couple of best practices:
- If you want to A/B test, do not run them on 100%
- Choose third parties that prioritise performance and limit their JavaScript
- Do you really need a heatmap? And if yes, do you need it all the time? Or can it be switched off sometimes, helping all your users?
- Are there third parties that you don’t use? Or very little? Remove them then.
- Are there third parties that overlap? Can you use one solution that offers multiple features instead of loading multiple libraries?
Tip 2. Do not delay all third parties/GTM until there’s an interaction
Doing this has been advised from time to time. And it likely will improve your lab data and thus Lighthouse scores. However, it could end up hindering your INP and real user experiences.
You can consider yielding the main thread instead. Remember the cookie notice example? A Consent Management Platform (CMP) doesn’t need to send all events to your GTM right after clicking the “Allow cookies” button.
Instead, a CMP should prioritise hiding the cookie consent modal. This can be achieved by yielding some tasks (sending events causing third parties to be loaded) until after visual feedback is completed.
Tip 3. Keep an eye on your DOM-size
AlpineJS -while a great reduction in code over Luma- is still a relatively heavy JavaScript file to execute. But you’re the one to dictate the performance costs below the line.
To prevent it from adding up, sparingly use event handlers, keep DOM sizes small or decide to skip the rendering of elements that aren’t even visible by using the content-visibility CSS property.
Tip 4. Smooth animations
When animating DOM nodes, make sure to use CSS properties that are automatically offloaded to the browser's GPU. This prevents style, layout, and rendering work from being performed, leaving the browser's main thread free for other tasks.
Everyone benefits: other JS and CSS work is completed faster, your animations run more smoothly, and INP is likely to benefit as well.
You may be wondering how to do this; simply stick to the transform and opacity CSS properties, and you will be able to create a variety of animations. An example is cookie notices: most still use the bottom CSS property instead of transform: translateY(-100%).
Conclusion
I hope this article has helped you better understand Interaction to Next Paint. We discovered that no two users have the same expectations, loading perceptions, devices, or device conditions. Similarly, no two websites, products, or performance challenges are the same. Poor Interaction to Next Paint can be caused by third-party integrations, your own JavaScript, or a combination of the two. It is not always JavaScript, but it is almost always JavaScript. And as we’ve also learned, browsers are just like men, and they can’t multitask.
You cannot improve what you do not measure. Use available tools and (new) APIs, such as DevTools and LoAF.
But to really understand what your audience is experiencing, you need to collect a lot of data. When you want to improve your Core Web Vitals, especially Interaction to Next Paint, Real User Monitoring (RUM) is a great place to start. That's why Google recommends it. It lets people with different levels of technical knowledge know what's going on and where it's happening. So, it's now easier to fix these issues, like cutting down on third-party's and keeping an eye on the size of your DOM. Improving INP makes the user experience better for everyone.
Because, most importantly, you want your users to be happy, not frustrated. To return to my original statement, you can see why the pagespeed community might not want to call INP the "Call to Action-metric". The "Respond to Action-metric" might be a better fit. And this new metric is undoubtedly important to make sure conversions happen. Good luck!
About RUMvision
A faster site means more conversions & higher sales. But what are your real visitors experiencing? Let RUMvision help you! We give you real-time data, clear dashboards to discover your real audience, Core Web Vitals, Third Party impact and & 40+ filters to deepdive. Save time searching, start real user monitoring. Finally get the insights you're looking for to make pagespeed optimization easier. Want to try it? We’d love to set up a free demo!
Want to learn even more about the Interaction to Next Paint? RUMvision is organising a free webinar on March 12th 2024, 4:00 PM CET. Come join us!