Cumulative Layout Shift: what is it and why should you fix it?
As part of our Web Performance Series on mastering Core Web Vitals with Karlijn Löwik from RUMvision, we previously learned about fixing Interaction to Next Paint (INP). Since March 12th, 2024, INP has become one of the three measures that define your website's Google Core Web Vitals score and therefore your SEO ranking. But what about the other two, Largest Contentful Paint (LCP) and Cumulative Layout Shift (CLS)?
Today, we shift our focus onto CLS - or in human words: visual stability on your website.
Because it is 2026 and the foundational stability of the web is still surprisingly shaky. Recent research from RUMvision showed that in the top 100 Dutch eCommerce, 20% are still failing CLS, which corresponds with global numbers. And even more interesting, Desktop is doing worse than Mobile!
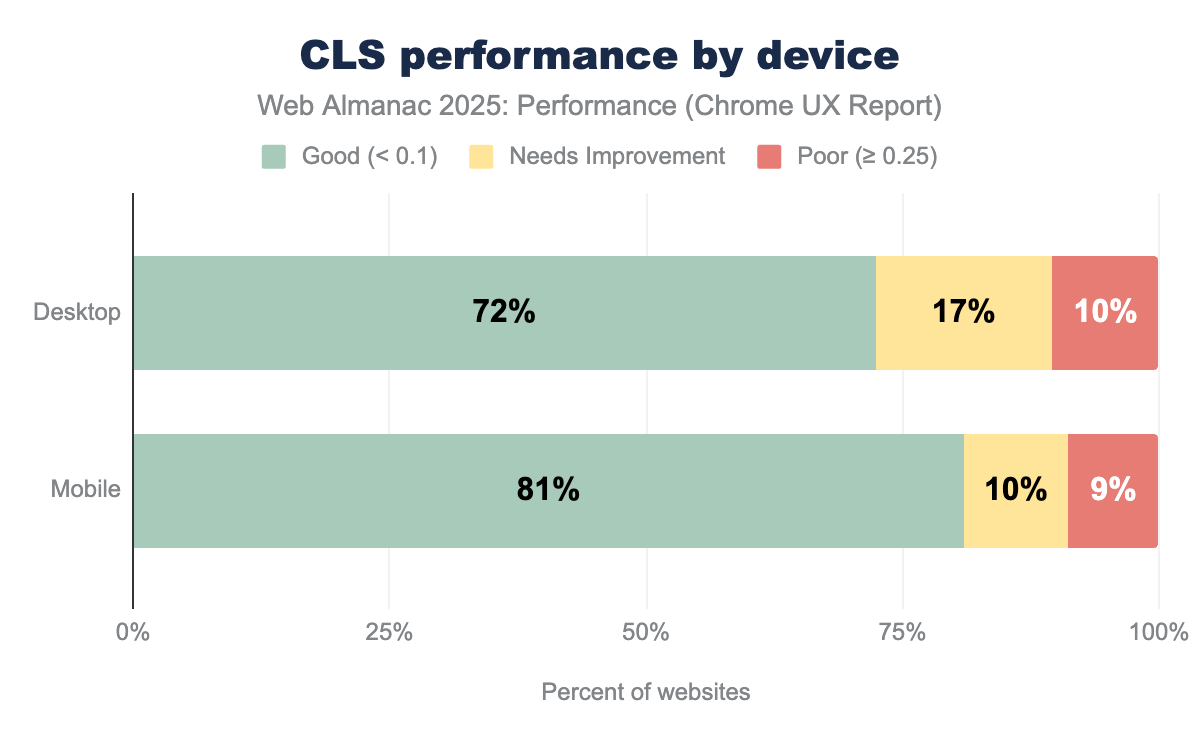
Source and copyright: Web Almanac 2025 on CLS
With so many sites moving things around unexpectedly, this is absolutely a metric in user experience to keep your eyes on. And the fix is often quite easy. The challenge? Finding them. In this article, we’ll help you master Cumulative Layout Shift.
About our Guest:
Karlijn Löwik is the CEO & Co-founder of RUMvision, on a mission to make web performance a business priority for every eCommerce company. Based in Groningen (NL), she’s an international web performance speaker, RUM-advocate and champion for women in tech. She serves as co-chair for the RUM W3C Group and as a board member of Mage-OS NL. She coined the term Sitespeed User Experience (SUX) - because let’s face it, good SUX sells!

Introducing Cumulative Layout Shift (CLS)
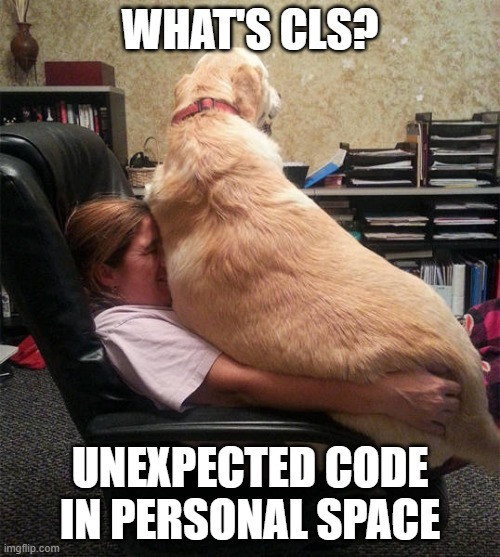
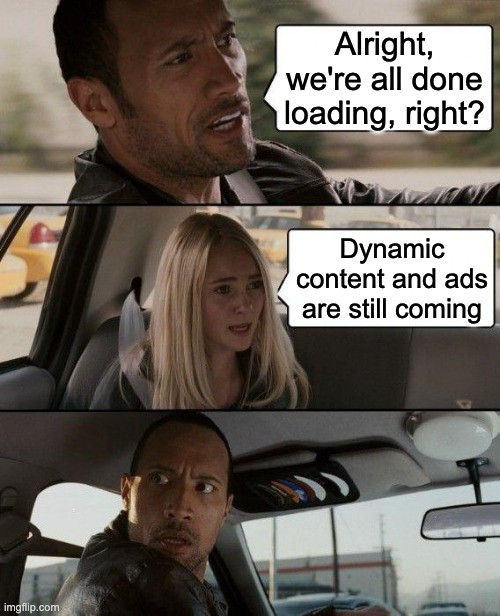
Want to understand what a Cumulative Layout Shift is? Look no further than this GIF, because rarely have I seen the frustration of a user encountering a CLS better depicted than here:

Source and copyright: CLS explained on web.dev
I mean, we’ve all encountered this in real life, right? Maybe you didn’t accidentally buy 56 items (I hope you didn’t!), but you definitely pressed a button, visited a product or clicked on an ad that you did not want to visit, because something suddenly shifted on the page.
The great thing about the Core Web Vitals is that this issue can be measured, giving you insights into where your own users are experiencing issues. And it’s measured over the whole page, because unexpected shifts are always annoying, and they can happen anywhere. CLS can only be measured in Chromium (Chrome, Edge, Brave, Vivaldi, Opera), unlike LCP and INP. Safari and Firefox do not support measuring it yet - I know, super unfair.
Why should you care about Cumulative Layout Shift (CLS)
As we already learned in our deep dive into the Interaction to Next Paint (INP), Google wants to promote a good page experience to users, and that goes way beyond the initial loading time.
When a page's layout changes unexpectedly, users may get annoyed for a number of reasons. For instance, they may click on the wrong button or link by accident, or they may lose their place in the text because of the sudden movement. In some situations, this can do a lot of damage. A customer may leave or order something that needs to be returned. Most often, it’s just massively annoying, and users do remember it when your site feels wonky and frustrating to use.
It’s also part of the Google ranking signal, which means if you fail on this Core Web Vital, you won’t get a benefit from that.
As always, though, every click counts, and if you have a user visit your site, it would be too bad to lose that conversion because of unexpected shifts happening that could have been prevented. Good SUX sells, remember?
How is CLS determined?
The CLS score is not based on seconds or milliseconds like the other Core Web Vitals are. Instead, it is a value that is based on how much and how far content is shifting.
You want your CLS to be below 0.1 on every page. If you want to learn how CLS is measured, check out this extensive web.dev article about CLS. It also explains how it measures expected vs unexpected layout shifts. Because the CLS measurements do consider user-expected layout shifts, such as accordions and slide-outs (issues there might get reported to the INP instead).
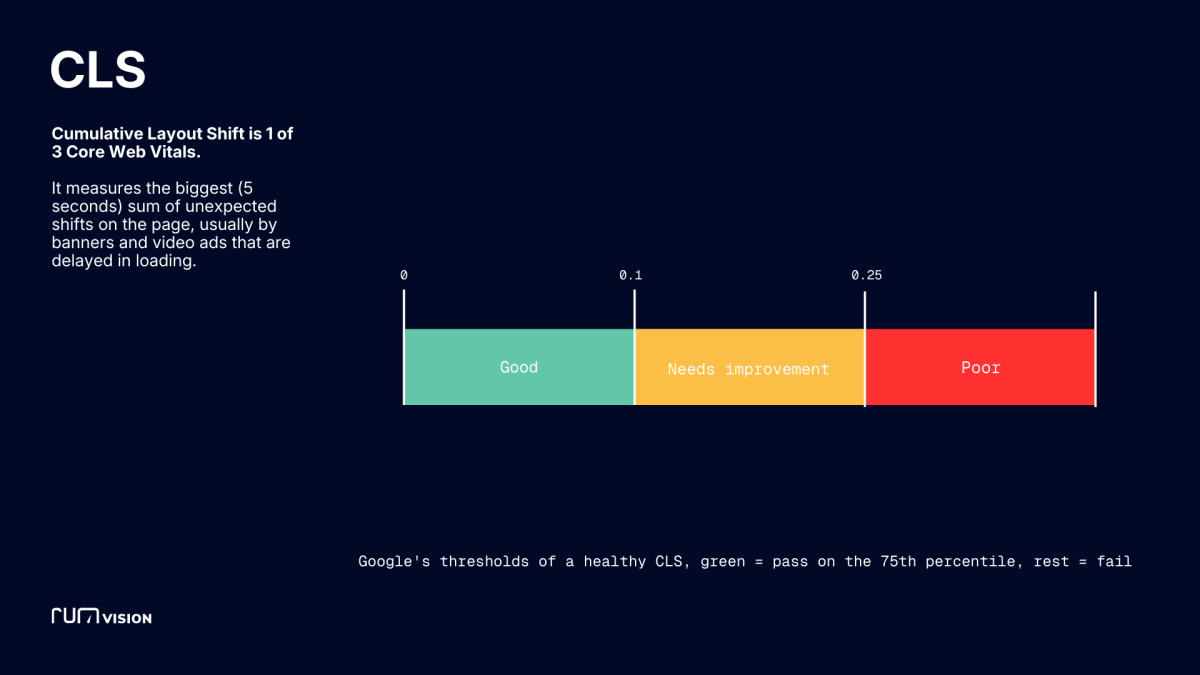
RUMvision explainer for thresholds and measurements CLS
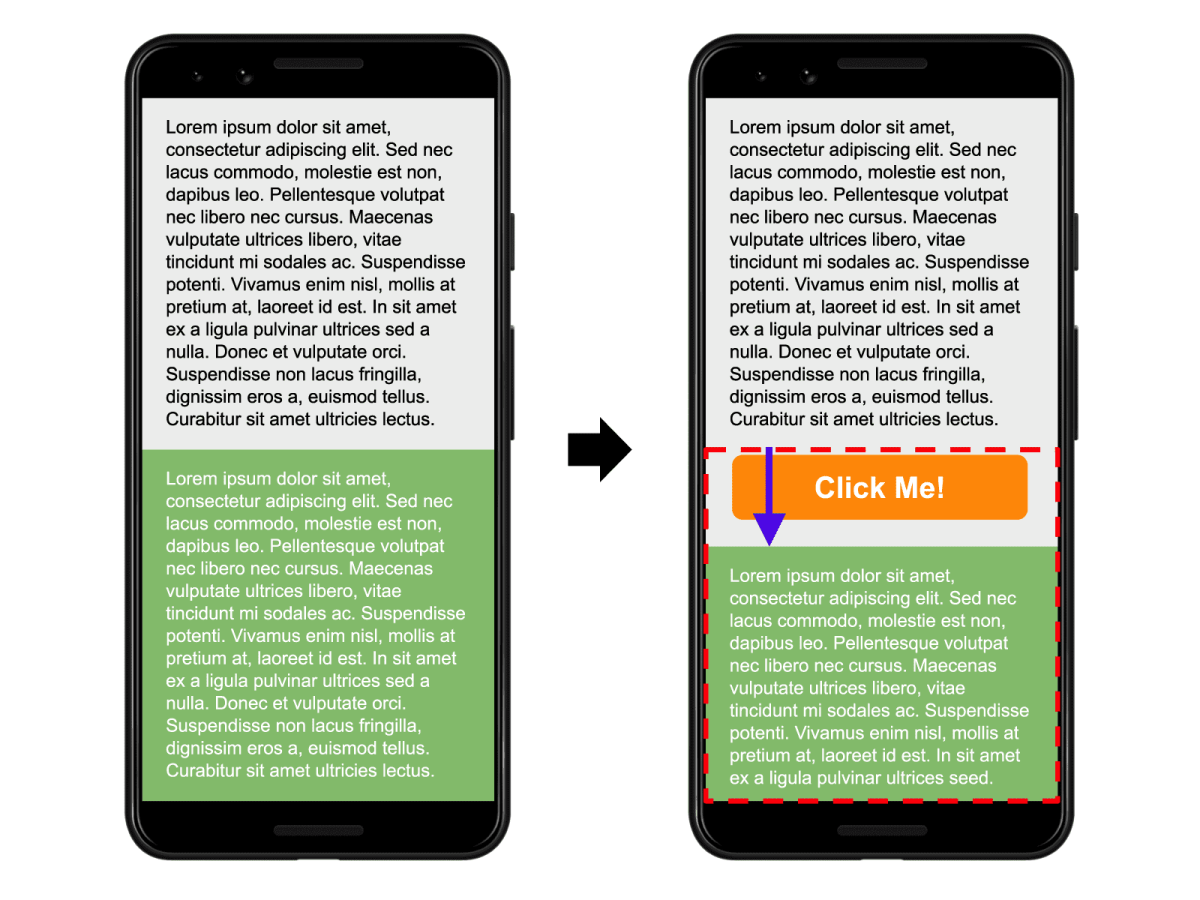
What causes a Cumulative Layout Shift (CLS)
A CLS occurs when a browser hasn't rendered page elements yet because it's prioritising something else.
Luckily for us, understanding why a CLS occurs is actually not that complicated. Although the way to fix it depends on what caused it, there is a major reason why it happens.
Reserving room for latecomers by setting dimensions
Like everywhere else in life, clear boundaries are important. This is also true in the world of frontend development. And the reason why most CLS issues happen is that the boundaries that an element would need in the page were not anticipated or defined.
Some examples of the most common causes of a poor CLS, as defined in the web.dev docs:
- Images without dimensions.
- Ads, embeds, and iframes without dimensions.
- Dynamically injected content, such as ads, embeds, and iframes, without dimensions.
- Web fonts.
See? Dimensions.

Why CLS often happens over time
We see this constantly in our RUM data: a site launches with a perfect 0.0 CLS, and everyone is happy. But then, real life happens. Over the next six months, the site accumulates what I call performance debt:
- Third-party additions: marketing adds a chat widget, a new review aggregator, or a tracking pixel. These scripts often join the party late and "shove" your layout around to make room for themselves.
- The "sale" banner: a promotion goes live and a giant banner is injected at the top of every page. If that banner doesn't have reserved dimensions, it pushes your entire site down, killing your CLS score for every single visitor.
- A/B testing flicker: most A/B tools swap content after the page looks ready. If that swap happens even 500ms after load, it counts as a layout shift.
Measuring CLS issues for your eCommerce site
As with everything related to web performance, there is a distinction between what can be measured using synthetic testing/lab data, such as Lighthouse and GTMetrix, and what can be measured using real user data, such as Core Web Vitals and RUM. To find and repair CLS issues on your Hyvä site, ideally, you use a combination.
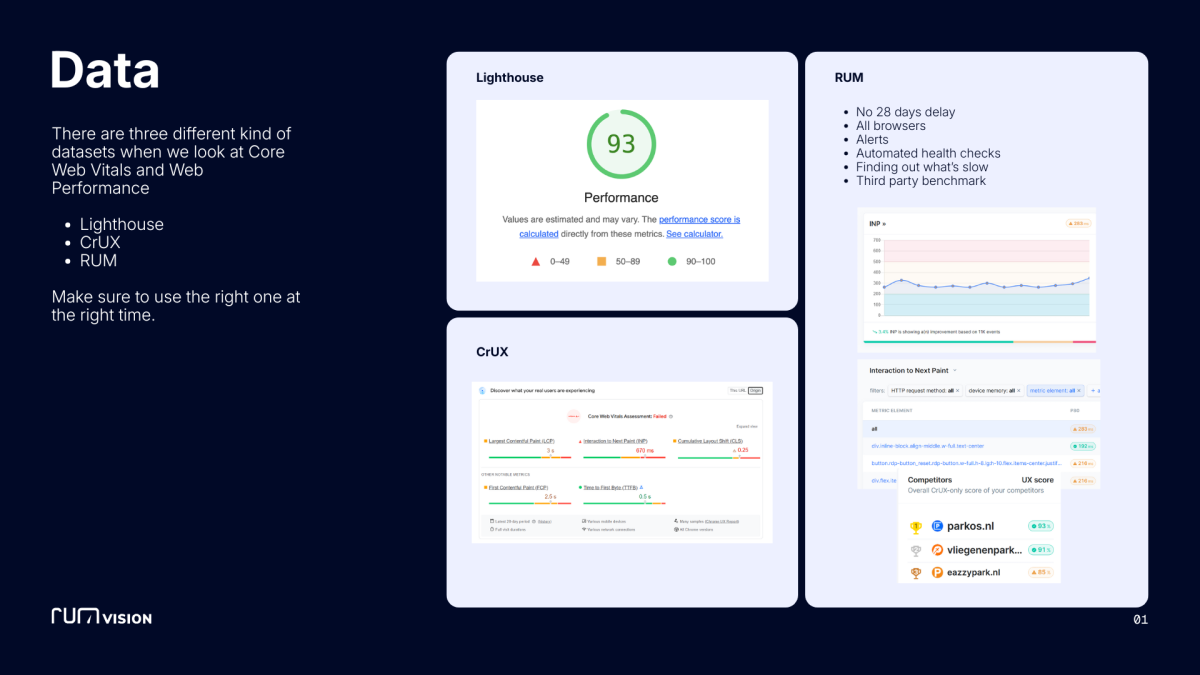
Source: RUMvision explainer for different web performance methods
Free tools to measure and monitor CLS with CrUX/ field data
Google Search Console (GSC): will give you insights if your Core Web Vitals failed on CLS. If you have enough data, it will also give you these insights per URL.
This is helpful because a CLS issue will often be on a template/page level, and not be on your whole site (exceptions are often fonts or top banners, which might happen on your whole site).
Knowing where it’s happening will give you a very good starting point in fixing it. Please remember though, with Core Web Vitals/ CrUX you are always looking at a 28 day rollover period. Meaning: that code you added yesterday? Won’t show up as a problem until at least 14 days have passed and only becomes fully visible 28 days later.
PageSpeed Insights for Core Web Vitals: will also be able to pinpoint whether you're having CLS issues.
RUMvisions Core Web Vitals 6 months history tool:. As layout changes are frequently introduced with new releases or third-party integrations, it can be useful to be able to pinpoint when a CLS issue first occurred. This might make it easier to figure out where to look in your code to fix the problem.
Free lab data tools to monitor CLS
Google Lighthouse: Cumulative Layout Shift can be measured within the lab/Lighthouse, but only partly. That’s why you’ll often see two different results when you do a PageSpeed Insight test between the Lighthouse and CrUX/ Core Web Vitals.
This is because Lighthouse can only measure the CLS that happens when a page is being loaded (they call this load-state issues). Just as with INP, it doesn't do interactions; it misses all the shifting that will happen after the page is done loading.
But elements can still shift after that moment. Google themselves differentiate this as the post-load issues. They can only be measured in real users' experiences, so CrUX/ Core Web Vitals. It can offer interesting suggestions to help you fix CLS issues, though, like this:
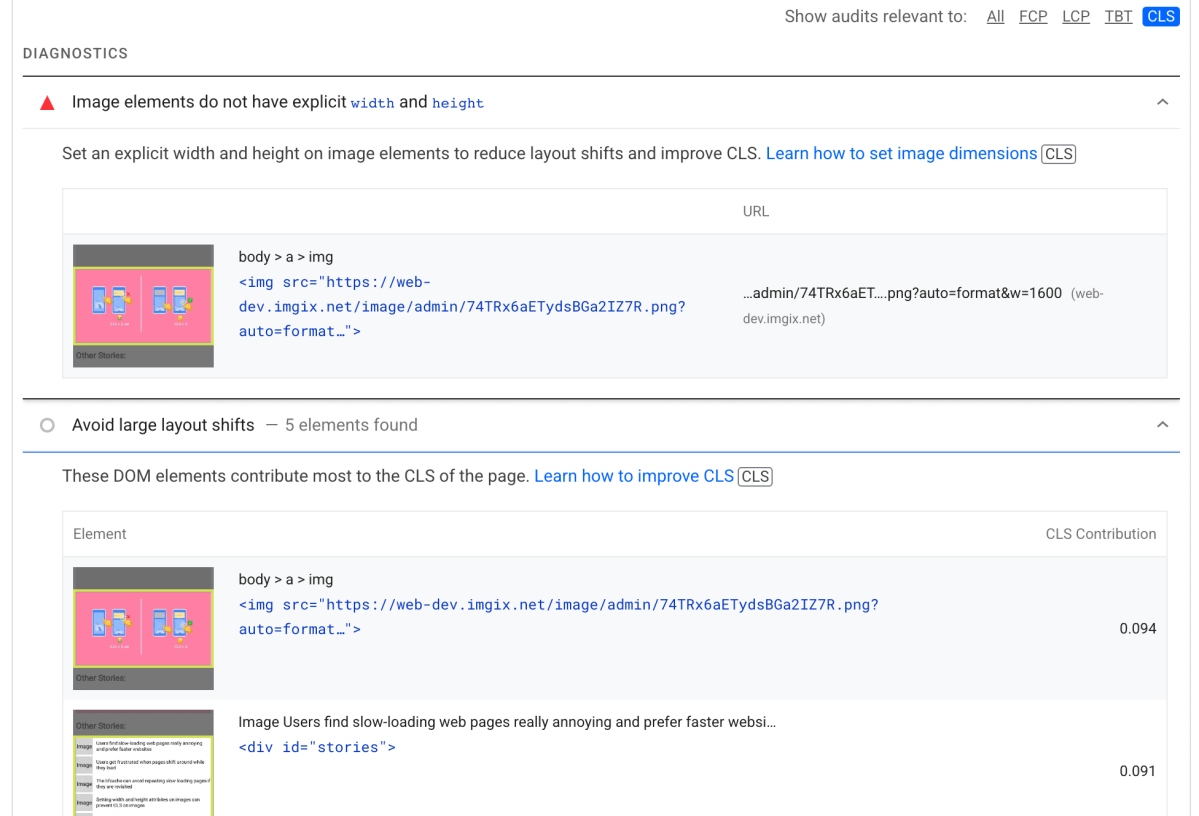
Source and copyright: optimize CLS with Lighthouse on web.dev
Chrome DevTools: my favourite method of debugging CLS issues is a recent addition in DevTools. When you run a trace, you can see where the CLS occurred.
→ It shows you the layout shifts and the scores
→ Which element is being pushed aside
→ And when making a recording you can even visualize the layout shift by hovering over the small purple diamond on the "layout shift" line
My colleague Jordy Scholing has a nice video how to use this feature on LinkedIn.
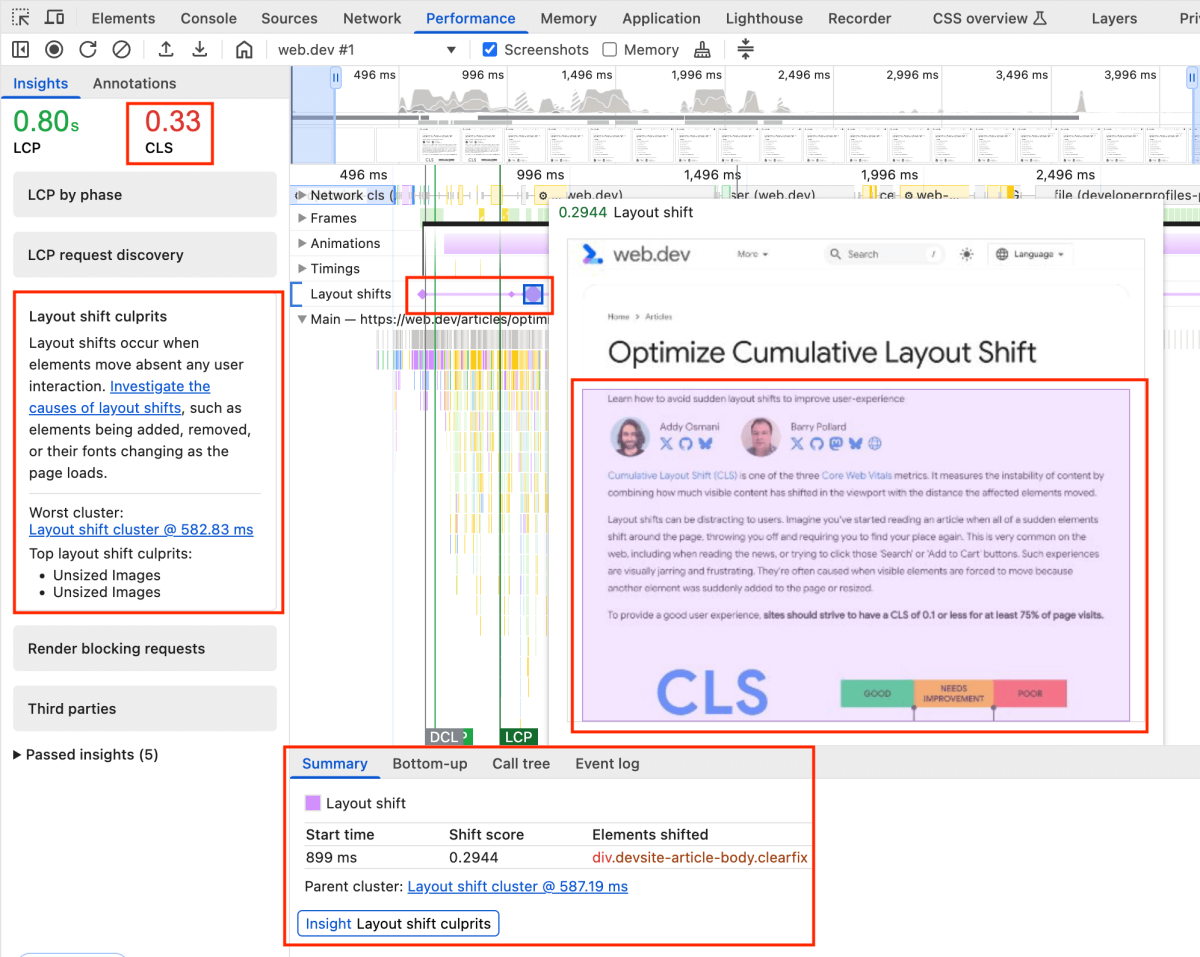
Source and copyright: optimize CLS with DevTools on web.dev
Other nice free tools for synthetic testing are: GTmetrix and WebPageTest.
RUM data to assist you in deepdiving CLS issues
But is there an even better way to keep track of your CLS issues? Glad you asked, yes! Real User Monitoring solutions - like RUMvision - can give you insights into what exactly was happening per template, per element and per device, because, as you can imagine, it can be quite a needle in a haystack search to find exactly what minuscule shift on a very specific device in a very specific element is shifting. And on what viewport?
As RUM-tracking is added to your own site to collect the data, you can track it in real time, instead of having to wait 28 days for Core Web Vitals to catch up. It can also group it per template, instead of only relying on a specific url.
This will help you visualise CLS issues much more easily, as we offer filters that show you the exact name of the code that's causing the issues.
Often knowing the name of the element and the viewports where it happens guides developers to implement the fix. Better yet, RUMvision will automatically guide you where your CLS issues are with our Healthcheck. And no manual checking all these free tools, you get a pro-active alert in your inbox when an unexpected CLS appears on your site. Super easy.
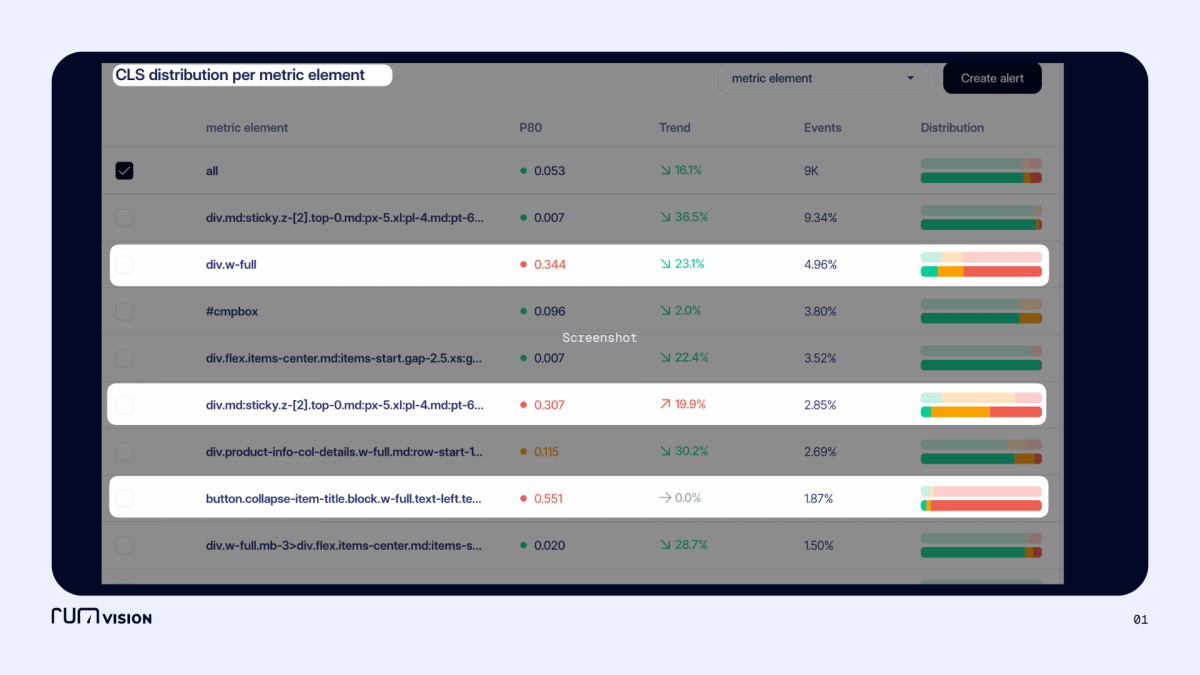
RUMvision showing CLS issues per metric element on a Hyvä shop
How Hyvä helps you improve CLS out of the box
This part is provided by Hyvä themselves, as they obviously know a lot more than I do regarding their efforts to improve performance.
Hyvä Themes was built from scratch with performance and precision in mind. It sends much less code to your browser than Luma (default Magento), which means smoother loading.
Because Hyvä was designed for performance from the start, it didn't need extra fixes added later (which usually makes things slower and heavier). Everything is clean and efficient.
Less code mainly helps with LCP (Largest Contentful Paint) and loading speed, but it also makes it easier to keep your layout stable. On top of this, we've built in several ways across our products to prevent layout shifts. In addition, several dedicated solutions have been implemented to prevent changes to the page layout.
Declaring element state without JavaScript
The default state (layout) of all elements (content) on the page is handled by the HTML markup and CSS. It is never reliant on JavaScript being run. This means avoiding parts of the page moving once JavaScript is loaded (i.e. layout shifts), even for elements that rely on JavaScript for additional interactivity.
For example, product sliders reserve the correct amount of space and output cleanly using native browser scrolling before the JavaScript (which creates the final carousel with arrows/dots, etc.) is loaded and runs. Essentially, all elements on the page should render correctly (look the same), even when JavaScript hasn’t yet run (or is disabled), and they shouldn’t move once JavaScript code is executed.
Try it out! If you disable JavaScript on https://demo.hyva.io/ (using Chrome DevTools) the page layout does not change (bar the inclusion of a global notice to let you know JavaScript is disabled!)
Furthermore, Hyvä reduces the reliance on JavaScript for areas where it is deemed unnecessary. And instead it utilises server-side rendering (SSR) for all non-private (customer-specific) data, and for pages that are not included in the full page cache (FPC), such as the cart and customer account area.
Examples include the SSR cart and all table/grid pages within the B2B suite in our Hyvä Enterprise offering for Adobe Commerce. Server-side-rendering not only reduces layout shifts but also eliminates additional unnecessary network requests to load data, which generally improves page rendering time substantially (especially on slower connections) - double win!
Defining image dimensions
All imagery has dimensions (width and height values) set so the browser knows to reserve the correct amount of space and ratio, and therefore avoid any shifts once the image has been loaded.
Product images have had these values set since the initial version of Hyvä Theme support for category images was added in 1.3.1 last year, and we recently added support for images added via Page Builder in our [1.3.10|1.3.11] release!
8 simple tips to improve CLS
Tip 1. Size your images
According to the HTTP Archive, 62% of mobile pages have at least one unsized image. The simplest fix is explicitly setting the width and height attributes in your HTML. Better yet, use the CSS aspect-ratio property so the browser reserves the exact space needed before the image even loads. And hey, we just learned that Hyvä supports this out of the box. Nice!
Tip 2. Keep CLS in mind with the font loading strategy
If your brand font pops in at a different size than the fallback font, your text will jump. Don't just use font-display: swap for speed - that only fixes the "invisible text" problem, not the shift.
Luckily we can use the CSS size-adjust property. It allows you to "scale" your fallback font (like Arial) so it takes up the exact same footprint as your brand font. It keeps the text block rock-solid while the pretty font loads in the background. For more deepdive info into font-strategies, I loved Mandy Michaels talk at performance.now() and web.dev also has great documentation on it.
Tip 3. Use CSS, not JS, for animations
JavaScript animations can be choppy and block the main thread. Stick to hardware-accelerated CSS animations like transform and opacity. They are much smoother and, more importantly, they don't trigger layout shifts. And bonus benefit: they help with INP as well.
Tip 4. Avoid DOM manipulation that isn't absolutely necessary
When the DOM is modified after the initial render, the browser must reposition elements to reflect the changes. It's best to avoid unnecessary DOM manipulation to reduce these shifts. If you must change the DOM, do so in a way that has the least impact on the layout, such as by using absolute positioning to keep elements in place.
This is also a very fancy term for: watch out for A/B tests if they alter elements or add elements or text.
Tip 5. Reduce dynamic content (JavaScript)
This CLS we see very often and is one that tends to happen over time (so, after an eCommerce site has been live for a while).
A layout shift happens due to content that gets generated on the fly, like “most popular products” or “products you’ll also like”. It's personalised and dynamic, and therefore often generated by …JavaScript.
And as we’ve learned in my latest article on INP, JavaScript is often the last one to join the party due to how browsers work. And thus: they push rendered elements away if they come in later.
There are 3 cases where we often see dynamic content issues happening in layout shifts.
- Personalised (third-party) scripts, like the ones mentioned above.
- Top banners, promoting a sale or special opening times.
- Ads that take up more space than expected. Video-ads being the worst layout offender.
The solution: Try to fix as much as you can with CSS (for instance, that topbanner). If you must have JS inserted dynamic content, then reserve room for it, with the aspect ratio fix, a skeleton loader or a min-height container so they have a "reserved seat".
Whatever you do, avoid putting these at the very top of the page. A shift at the top moves everything below it, and your CLS score will reflect that pain.
Source and copyright: understanding CLS, on web.dev
Tip 6. Use scrollbar-gutter: stable
Ever noticed a page "twitch" slightly left when a long list loads and the scrollbar appears? It's a tiny shift, but it counts. Use scrollbar-gutter: stable; in your CSS. It reserves that 15px of space from the start so the page stays rock-solid even when the scrollbar pops in.
Tip 7. Control off-screen rendering
Use content-visibility: auto; for heavy areas like your footer. It tells the browser, "don't worry about rendering this until the user gets close." It saves processing power and prevents off-screen shifts. Just make sure to use contain-intrinsic-size as a placeholder so your scrollbar doesn't jump around as the user scrolls down!
Tip 8. Support the bfcache
Using the back/forward cache is a browser-native way to restore pages to an instant snapshot. In my article on the bfcache, I explain that this is the ultimate solution for instant page loading - and it is a massive win for stability/CLS as well. If a user hits the "back" button, the page should appear exactly as it was, with zero shifts.
Hyvä now has native support for this, but don't just "set it and forget it." To make it work correctly, you need to adjust a specific setting. You must either ensure your Varnish configuration doesn't send a no-store header (which kills the cache), or you need to adjust your frontend to allow the browser to keep that snapshot in memory. If you get this right, you give your users an "instant" feel. This is a great win for all Core Web Vitals, and can help about 30% of pagevisits. Do this today if you can!
Conclusion: don’t let shi(f)t happen
In my opinion, CLS is the easiest Core Web Vital to pass. You just have to keep an eye on it - or better yet, get an automated alert from RUMvision when things go wonky - and use one of the tricks above to fix it.
The problem is that it’s also one of the easiest metrics to get wrong over time, because well, shiFt happens. You just need to make sure you find it quickly before it tanks your conversion rate.
Or, as Addy Osmani (back then with Chrome) famously set as a goal:
“Frontend developers: stop moving things that I’m about to click on.”
I think we can all agree on that!
Next up! Largest Contentful Paint (LCP). Will it be my longest article yet? Will I also blame JavaScript for all its issues? Stay tuned to find out!